
Safety and Security in Numbers
This slideshow steps through five World Bank indicators used to describe safety and security: intentional homicide, road traffic deaths, suicide mortality, military spending as a share of GDP, and the control-of-corruption score. Each frame ranks every country with data for that indicator, highlights the United States, and traces its own path over the years available. All figures come from the World Bank's World Development Indicators.
| Intentional homicides | 134 | US intentional homicides: 5.7634 per 100,000 in 2023, 134th of 196 |
| Road traffic deaths | 82 | US road traffic deaths: 12.7 per 100,000 in 2019, 82nd of 190 |
| Suicide mortality rate | 162 | US suicide mortality: 15.63 per 100,000 in 2021, 162nd of 185 |
| Military spending (% of GDP) | 141 | US military spending: 3.4192% of GDP in 2024, 141st of 164 |
| Control of corruption | 37 | US control of corruption: a score of 69.8552 in 2024, 37th of 206 |
Read each frame on its own: the ranking bar chart shows where the highlighted country falls within that indicator only, and the trend line shows its direction of travel. Do not compare values or ranks across frames — the units differ (rates per 100,000, percent of GDP, a 0-100 score), the country counts run from 164 to 206, and the latest year ranges from 2019 to 2024.
The Short Version
Across the five indicators in this edition, the United States does not sit at one end of the scale — it sits in different places depending on what is being counted. The clearest marker is intentional homicide: 5.7634 per 100,000 people in 2023, which places the US 134th of 196 countries and slightly above the world value of 5.2. Road traffic deaths run the other way relative to the world (12.7 per 100,000 in 2019 against a world value of 16.7502), yet they are still three to four times the level of Germany, Japan or the UK. Suicide mortality (15.63 per 100,000 in 2021, 162nd of 185) is about 1.7 times the world value of 9.1303, military spending is 3.4192% of GDP in 2024 against a world value of 2.4692%, and control of corruption scores 69.8552 out of 100, ranking 37th of 206.
Sources: World Bank, World Development Indicators — Intentional homicides (VC.IHR.PSRC.P5); Mortality caused by road traffic injury (SH.STA.TRAF.P5); Suicide mortality rate (SH.STA.SUIC.P5); Military expenditure, % of GDP (MS.MIL.XPND.GD.ZS); Control of Corruption governance score (GOV_WGI_CC_SC).
The Headline Indicator: Latest Value
The lead indicator here is the intentional homicide rate. For the United States the latest figure is 5.7634 per 100,000 people in 2023, ranking 134th out of 196 countries covered. Ranks in this edition are produced mechanically by sorting values from low to high, so a higher rank number simply means a higher recorded rate. The world value for the same indicator is 5.2 per 100,000, so the US figure is roughly 11% above it — close to the global level rather than far from it, which is unusual for a country with the income level of the United States.
Source: World Bank, World Development Indicators — Intentional homicides (per 100,000 people), VC.IHR.PSRC.P5.
Who Is at the Top and at the Bottom
At the low-rate end of the homicide table the entry ranked first is listed only as the code "CHI" at 0.0, followed by Qatar and Singapore (both 0.0691), Oman (0.1386), Bahrain (0.1956) and Japan (0.2292). Gulf states, city-states and East Asian countries dominate this end, along with small territories such as French Polynesia (0.3711) and Hong Kong (0.3762). At the high-rate end the list is heavily concentrated in the Americas, much of it in the United States' own hemisphere: Turks & Caicos Islands 76.34, St. Kitts & Nevis 64.1601, St. Vincent & Grenadines 51.3213, the U.S. Virgin Islands 49.8571, Jamaica 49.4403, Ecuador 45.7228, South Africa 43.7203, Haiti 41.1518, Trinidad & Tobago 40.4433, St. Lucia 39.0441 and the Bahamas 32.1981. At 5.7634 the United States is far from both ends — an order of magnitude below the Caribbean island economies that fill the bottom of the table, and an order of magnitude above the Gulf and East Asian countries at the top.
Source: World Bank, World Development Indicators — Intentional homicides (per 100,000 people), VC.IHR.PSRC.P5.
How It Has Changed Over the Past Decade
The US homicide series is not a straight line. It fell to 4.3836 in 2014, rose to 5.2898 by 2016, eased back to 4.9347 in 2019, then jumped to 6.3547 in 2020 and 6.7797 in 2021 — the highest value in the twelve years shown — before falling to 6.5127 in 2022 and 5.7634 in 2023. That is about 15% below the 2021 peak but still above the 4.9347 recorded in 2019. Road traffic deaths moved within a narrower band: 13.4 in 2008, a low of 11.6 in 2011, and 12.7 in 2019, so the level at the end of the series is close to where it began. Suicide mortality rose fairly steadily, from 13.2 in 2010 to 15.63 in 2021, an increase of roughly 18%, with a dip to 14.96 in 2020 before the 2021 figure. Military spending fell from 4.0237% of GDP in 2013 to a low of 3.2977% in 2017, touched 3.6452% in 2020, and stood at 3.4192% in 2024. The control-of-corruption score peaked at 74.2866 in 2017 and has drifted down since, reaching 69.8552 in 2024 — the lowest value in its own 2013–2024 series.
Sources: World Bank, World Development Indicators — VC.IHR.PSRC.P5; SH.STA.TRAF.P5; SH.STA.SUIC.P5; MS.MIL.XPND.GD.ZS; GOV_WGI_CC_SC.
Comparing With Similar Countries
Against the other large economies in this dataset, the homicide gap is the widest of the five. The US rate of 5.7634 is about 4.3 times France (1.3351), 5.2 times the UK (1.1187), 6.3 times Germany (0.9107), 11.5 times China (0.5019), 12.1 times South Korea (0.4773) and 25 times Japan (0.2292). Road deaths follow the same direction but with smaller multiples: 12.7 in the US against 3.2 in the UK, 3.6 in Japan, 3.8 in Germany, 5.1 in France and 8.6 in South Korea, while China at 17.4 is higher than the US. On suicide the picture is mixed: South Korea (27.53), Japan (17.43) and France (16.58) are above the US figure of 15.63, while Germany (12.9), the UK (9.55) and China (8.95) are below it — the UK level is about 60% of the US level. Military spending at 3.4192% of GDP is the highest in this comparison group, ahead of South Korea (2.5621%), the UK (2.2786%), France (2.0526%), Germany (1.8919%), China (1.7113%) and Japan (1.3714%). On control of corruption the US score of 69.8552 (37th of 206) sits below Germany 83.7516 (13th), the UK 78.4146 (20th), Japan 75.3229 (24th) and France 72.5135 (29th), and above South Korea 65.0512 (43rd) and China 49.6499 (89th).
Sources: World Bank, World Development Indicators — VC.IHR.PSRC.P5; SH.STA.TRAF.P5; SH.STA.SUIC.P5; MS.MIL.XPND.GD.ZS; GOV_WGI_CC_SC.
How to Read These Numbers
Every rank on this page is produced by sorting values from smallest to largest — except control of corruption, where a higher score sorts first. A rank is a position in a list, not a judgement. That matters most for military spending, where a country's share of GDP reflects policy, alliances and the size of its economy, so neither a low nor a high position should be read as a score. Definitions also limit what can be compared. Recorded homicide rates depend on national crime statistics — how attempts, missing persons and deaths of undetermined intent are classified — and on investigative and record-keeping capacity, so countries with weaker statistical systems may appear lower than the underlying reality; the very small territories at either end of the table also have small population denominators and can swing sharply from year to year. Suicide mortality depends on how a cause of death is certified, and under-recording is possible where social or religious context discourages the classification. Control of corruption is a 0–100 composite score built from multiple surveys and assessments rather than a measured quantity, and this dataset carries no world value for it. Finally, the reference years differ: homicide is 2023, road deaths 2019, suicide 2021, and military spending and corruption 2024 — so these should not be summarised as a single snapshot of one moment, and the road-death figure in particular predates any changes in travel patterns after 2019. The five indicators are also separate measurements; movement in one should not be read as a cause or consequence of movement in another.
Sources: World Bank, World Development Indicators — VC.IHR.PSRC.P5; SH.STA.TRAF.P5; SH.STA.SUIC.P5; MS.MIL.XPND.GD.ZS; GOV_WGI_CC_SC.
Intentional homicides on the map and in charts
| Rank | Country / area | per 100,000 |
|---|---|---|
| 2 | Qatar | 0.07 |
| 3 | Singapore | 0.07 |
| 4 | Oman | 0.14 |
| 5 | Bahrain | 0.2 |
| 6 | Japan | 0.23 |
| 132 | Greenland | 5.35 |
| 133 | Burundi | 5.65 |
| 134 | US | 5.76 |
| 135 | Yemen | 5.81 |
| 136 | Mongolia | 5.92 |
| 194 | St. Vincent & Grenadines | 51.32 |
| 195 | St. Kitts & Nevis | 64.16 |
| 196 | Turks & Caicos Islands | 76.34 |
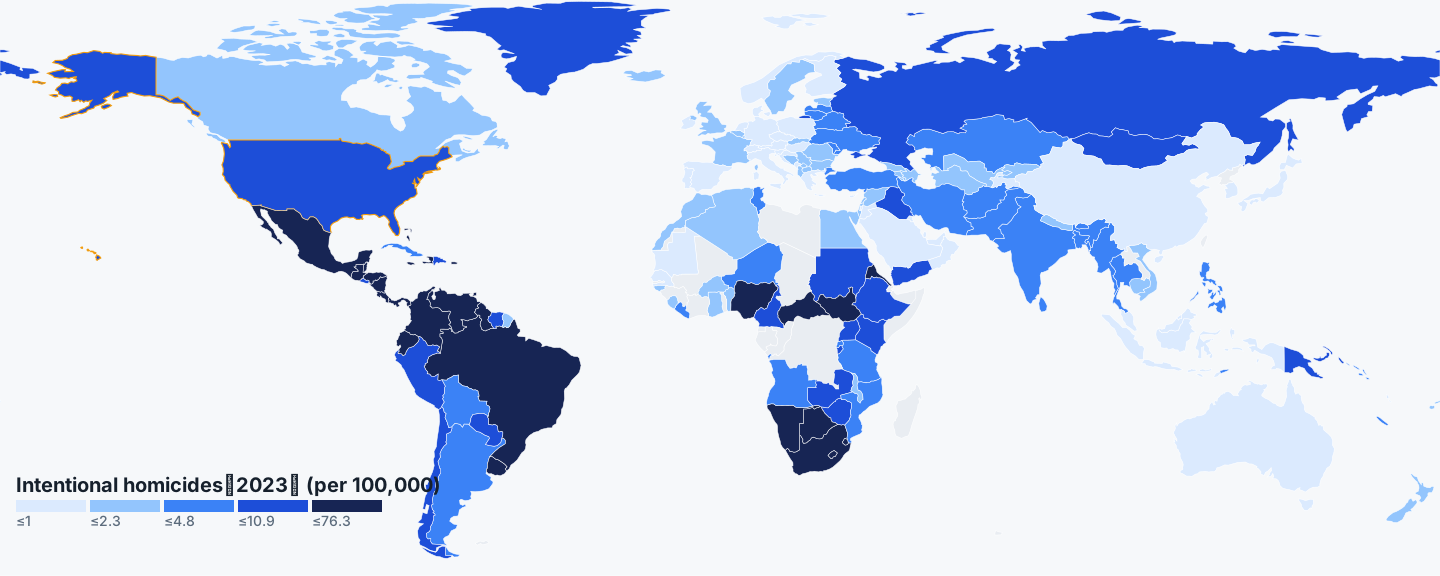
The low end of the table is filled by Gulf states and city-states — Qatar and Singapore at 0.0691, Oman 0.1386, Japan 0.2292 — while the high end is dominated by Caribbean and Latin American economies, from Turks & Caicos Islands 76.34 down to the Bahamas 32.1981. The US at 5.7634 sits well inside the middle of that range.
The bar chart shows how stretched this indicator is: the distance from top to bottom spans more than three orders of magnitude. The US trend line rises from 4.3836 in 2014 to a peak of 6.7797 in 2021, then falls back to 5.7634 in 2023.
Compare countries
Road traffic deaths
| Rank | Country / area | per 100,000 |
|---|---|---|
| 1 | Antigua & Barbuda | 0 |
| 2 | Monaco | 0 |
| 3 | San Marino | 0 |
| 4 | Micronesia | 0.2 |
| 5 | Maldives | 1.6 |
| 80 | Kazakhstan | 12.7 |
| 81 | Kyrgyzstan | 12.7 |
| 82 | US | 12.7 |
| 83 | Mexico | 12.8 |
| 84 | Pakistan | 13 |
| 188 | Venezuela | 39 |
| 189 | Zimbabwe | 41.2 |
| 190 | Dominican Republic | 64.6 |
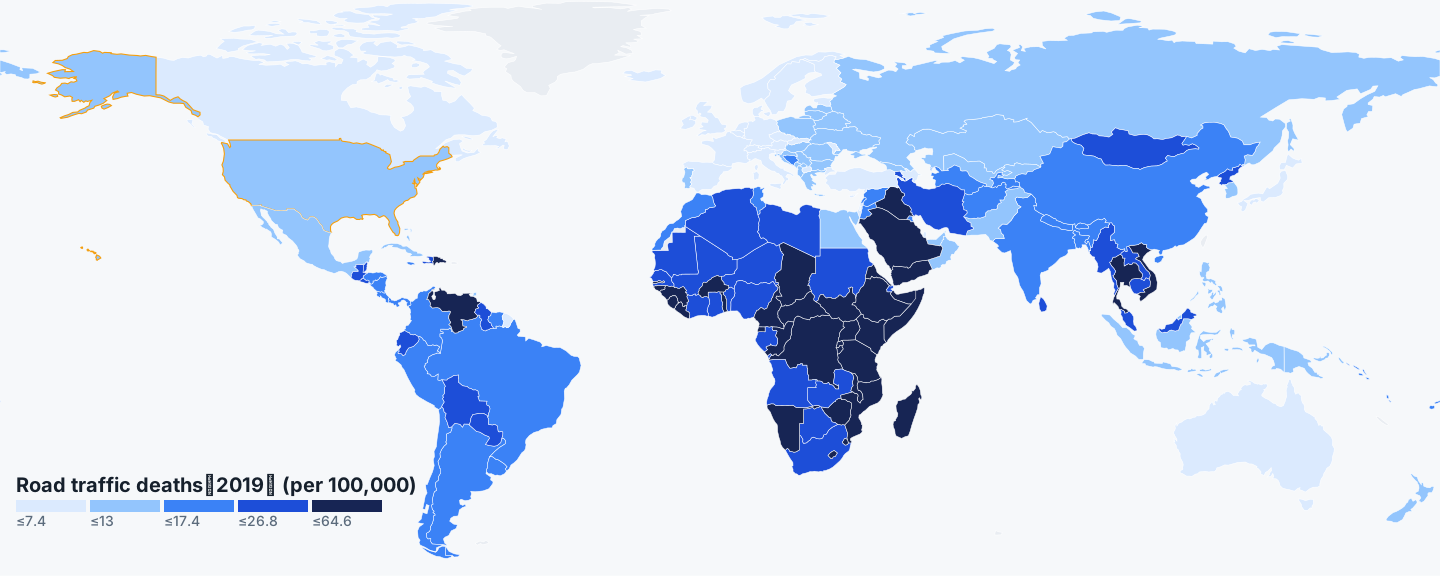
Ranks run from the lowest death rate upward: Antigua & Barbuda, Monaco and San Marino share the top at 0.0, while the Dominican Republic closes the table at 64.6. The US at 12.7 is well behind the small, wealthy countries clustered at the top, such as Iceland (2.0) and Norway (2.1).
The trend covers 2008 to 2019 and moves little overall: 13.4 in 2008, a low of 11.3 in 2014, then a drift back up to 12.7 in 2019. Against peers the distance is large — Japan 3.6, the UK 3.2, Germany 3.8 and France 5.1 are all a fraction of the US rate, while China stands higher at 17.4.
Suicide mortality rate
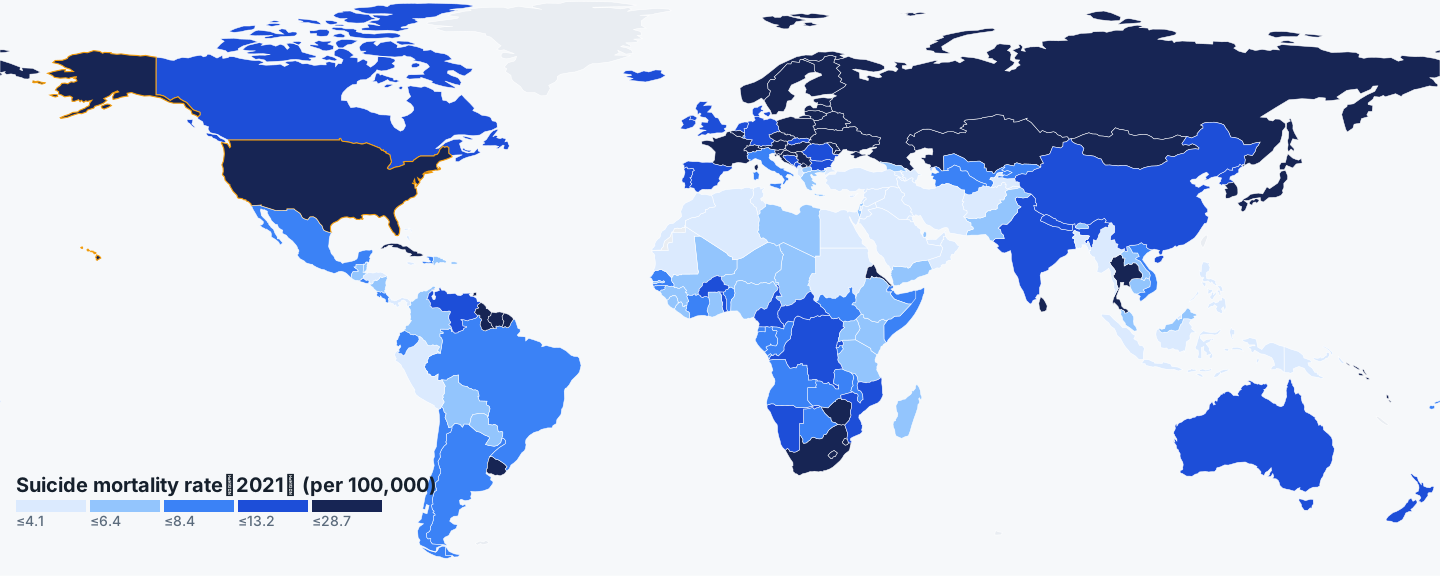
The top of the table is dominated by countries reporting very low rates, from St. Vincent & Grenadines at 0.41 to Antigua & Barbuda at 1.46, while the bottom runs from Solomon Islands at 19.6 to Lesotho at 28.66. The US value of 15.63 falls between these two blocks but much closer to the high end.
Between 2010 and 2021 the line climbs steadily, from 13.2 to 15.63, with only a brief dip in 2019 and 2020 before the 2021 rise. Among peers, South Korea is highest at 27.53 and Japan at 17.43 also exceeds the US, while the UK (9.55), China (8.95) and Germany (12.9) sit lower.
Military spending (% of GDP)
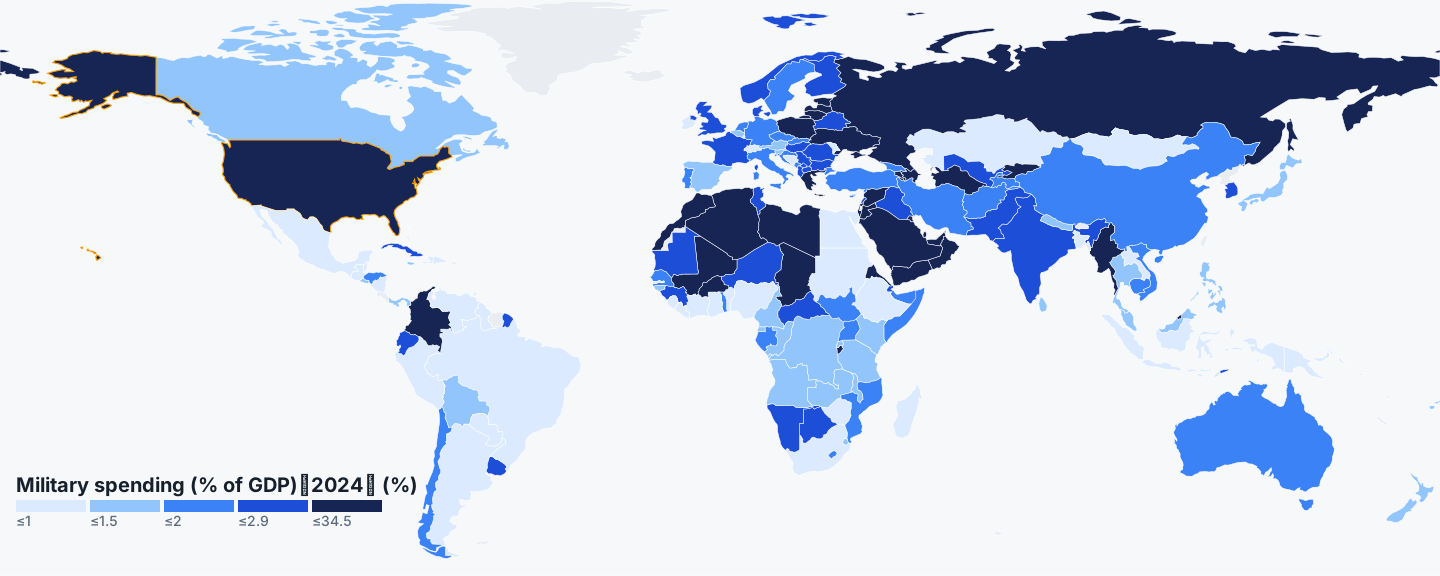
The table starts with countries spending almost nothing as a share of their economy — Haiti 0.07%, Mauritius 0.15%, Laos 0.19%, Ireland 0.24% — and ends with Ukraine at 34.48% and Eritrea at 20.87%, both far above everyone else. The US share of 3.42% sits in the upper section but is nowhere near those extremes.
From 2013 to 2024 the share drifts down and then steadies: 4.02% in 2013, a low of 3.30% in 2017, a bump to 3.65% in 2020, and 3.42% in 2024. Every peer shown spends a smaller share — South Korea 2.56%, the UK 2.28%, France 2.05%, Germany 1.89%, China 1.71% and Japan 1.37%.
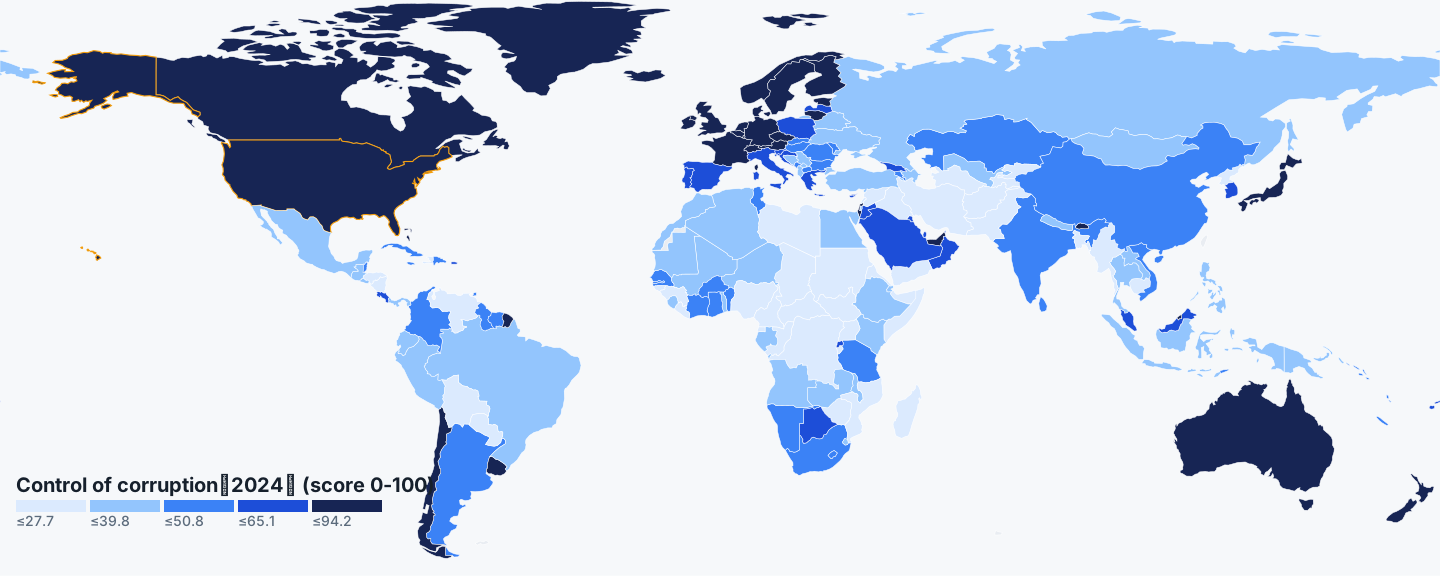
Control of corruption
| Rank | Country / area | score 0-100 |
|---|---|---|
| 1 | Denmark | 94.16 |
| 2 | Finland | 92.23 |
| 3 | Luxembourg | 88.66 |
| 4 | Switzerland | 88.48 |
| 5 | Singapore | 87.69 |
| 35 | United Arab Emirates | 71.54 |
| 36 | Chile | 70.24 |
| 37 | US | 69.86 |
| 38 | Lithuania | 67.95 |
| 39 | Cape Verde | 66.9 |
| 204 | Syria | 13.41 |
| 205 | Somalia | 11.7 |
| 206 | South Sudan | 6.06 |
Unlike the other frames, this table is ordered from the highest score down: Denmark leads at 94.16, followed by Finland 92.23 and Luxembourg 88.66, while South Sudan (6.06) and Somalia (11.70) sit at the bottom. The US score of 69.86 places it below every country in the top twelve shown here.
The 2013-2024 line trends gently downward: 71.75 in 2013, a high of 74.29 in 2017, then a decline to 69.86 in 2024 — the lowest value in the series. Peers split around it, with Germany (83.75), the UK (78.41), Japan (75.32) and France (72.51) scoring higher, and South Korea (65.05) and China (49.65) lower. This frame has no world value in the source.